I’ve been meddling with MySQL for Python the past week to make my data more sustainable then just keeping it in RAM and losing all my data when I shut down Python... I’ll reserve my horrors of installing MySQL for some other post, but everything is working now. So the first thing I tried was taking the ASCII exports with the pressure data and get them in my database.
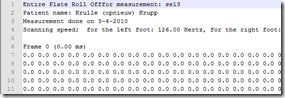
The ASCII export can come in two flavors, I wish it didn’t but I’m 100% sure that if I focus on the right format, tomorrow I’ll get someone who uses the left... Either way, currently I parse the file using Joe Kingston’s code he kindly supplied earlier (follow this link for the code). This strips the headers off and eventually puts the data in a numpy array.
class Datafile(object):
"""
Reads in the results of a single measurement.
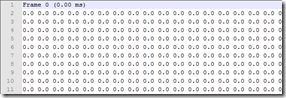
Expects an ascii file of timesteps formatted similar to this:
Frame 0 (0.00 ms)
0.0 0.0 0.0
0.0 0.0 0.0
Frame 1 (0.53 ms)
0.0 0.0 0.0
0.0 0.0 0.0
...
"""
def __init__(self, filename):
self.filename = filename
def __iter__(self):
"""Iterates over timesteps. Yields a time and a pressure array."""
def read_frame(infile):
"""Reads a frame from the infile."""
frame_header = infile.next().strip().split()
time = float(frame_header[-2][1:])
data = []
while True:
line = infile.next().strip().split()
if line == []:
break
data.append(line)
return time, np.array(data, dtype=np.float32)
with open(self.filename) as infile:
while True:
yield read_frame(infile)
def load(self):
"""Reads all data in the datafile. Returns an array of times for each
slice, and a 3D array of pressure data with shape (nx, ny, ntimes)."""
times, dataslices = [], []
for time, data in self:
times.append(time)
dataslices.append(data)
return np.array(times, dtype=np.float32), np.dstack(dataslices)
(Note: I've long since rewritten this part, to make it more suit my needs)
Then in my best newbish SQL I created a connection to the database:
mydb = MySQLdb.connect('localhost','ivo',’*******’,'data')
cur = mydb.cursor()
Then I did a standard insert statement for every value:
ny, nx, nz = np.shape(data)
query = """INSERT INTO `data` (frame, sensor_row, sensor_col, value) VALUES (%s, %s, %s, %s)"""
for frames in range(nz):
    for rows in range(ny):
        for cols in range(nx):
            cursor.execute(query, (frames, rows, cols, data[rows,cols,frames]))
Now I knew this wasn’t efficient, but I just wanted to make sure ‘it worked’. But taking 6 minutes is off course unacceptable, though I was trying to insert 4.000.000 values, what was I expecting? Anyway, after reading another chapter from MySQL for Python, I learned about executemany() which instead of having a separate insert for each value, takes a tuple with all the data you want to insert and batch processes that.
Furthermore, I decided that it was far easier to ditch all the zeros from my data (as you can see above, it’s over 99% of the data...), so I added a simple if statement to get rid of them.
query = """INSERT INTO `data` (frame, sensor_row, sensor_col, value) VALUES (%s, %s, %s, %s ) """
values = []
for frames in range(nz):
    for rows in range(ny):
        for cols in range(nx):
            if data[rows,cols,frames] > 0.0:
                values.append((frames, rows, cols, data[rows,cols,frames]))
cur.executemany(query, values)
This magically reduced the entire processing time to about 20 seconds, of which 14 seconds are spend on building values, which is a list with 37k tuples with all the data. Still not very efficient, since it would take me 10 minutes to process all the data of one dog.
Luckily, Stack Overflow came to the rescue once more:
query = """INSERT INTO `data` (frame, sensor_row, sensor_col, value) VALUES (%s, %s, %s, %s ) """
values = []
rows, cols, frames = numpy.nonzero(data)
for row, col, frame in zip(rows, cols, frames):
    values.append((frame, row, col, data[row,col,frame]))
cur.executemany(query, values)
Some suggested turning off indexing, while inserting the data. I’m 100% it helps, I just couldn’t see a noticeable impact. So for now I’ll just leave it out for simplicity sake.
But f00 pointed me to something else that was quite interesting: LOAD DATA INFILE, but for the life of me, I just couldn’t get it to parse the file correctly. However, if it would allow the database to load the file directly, that would take away any overhead from Python. Though potentially at the cost of keeping all those zeros... (perhaps it’s possible to get this data compressed?!?)
Anyway, f00 asked me to elaborate on:
but can you post a little more info about what you do with the data once loaded as it will determine the direction of my design. Posting any table definitions you have, numbers of patients, frequency of scans/measurements, typical queries
Well part of the problem is that I know so little of SQL that while I’ve tried thinking it through, I simply don’t know how to manage my data yet! However, the basic workflow would be:
 to the subject, which needs to be stored in the database. Furthermore, you should also be able to lookup a subject already stored in the database later on to analyze the results or edit his data. For the current study it were 24 measurements per dog, but in normal cases I’d expect it to be about 10 measurements. Furthermore, there were about 30 subjects, but the clinic already measured over 100 additional subjects...
Processing
If you have new data, we process it. This means loading the data from the database, calculating new things like: where are the contacts, where do these contacts belong to and when you’re done all the results. These results need to be stored in the database as well, so each of these results will get their own table. For dogs, each measurement has about 8 contacts or more (up to 15-20); humans often would have anything between one-four contacts in one measurement.
Analyzing
Most of the time, measurements are done in several conditions. You either want to compare those measurements with each other or compare it with ‘normal data’. Looking at single contacts isn’t as valuable, due to variations, so I would query all the results from measurements with similar conditions. However, I don’t want to average running with walking, so I need to be able to pick a certain condition and calculate average results for those. Most results are values over time, like the progression of the total pressure, the center of pressure, the pressure for each toe or more ‘static’ values, such as the orientation/rotation of the paw, the moments of peak pressure etc.
Because we measured healthy dogs in this study, but have already measured a sizable amount of lame dogs, I would want to compare the measurements of a lame dog to the averages of my healthy dogs. I’m not 100% sure whether it’s better to calculate these values when I need them or to store them in my database, to be more efficient.
Reporting
While this is mostly the same as analyzing: you make a selection of the data you want and I’ll output it to a file (csv or whatever would be the most useful) or a pdf report. So again, I need to be able to refine my queries to retrieve the right data.
This would probably result in the following tables (more or less):
.
- My data ‘feels’ clustered in groups that belong to each other, anything that needs multiple rows for the same data is in it’s own table (protocol, side, zones, parameter, data).
- I guess I have to think about what my primary keys are, but I honestly believe it’s ok-ish.
I still don’t know what the heck to do with calculating averages. since it has to be used in daily practice and won’t have some powerful server to run on, I can’t calculate it again for every measurement. While I could make separate tables (or IDs) for averaged data, I’d still need to come up with a sensible way to calculate them and keep them up to date. Any suggestions are definitely welcome!
BTW for those who claim I shouldn’t bother with averaging: show me how to average a couple hundred 3D arrays (albeit small, 15x15x50), which need normalizing before they can even be averaged...