It has been quiet for quit some time, so I’ll try to get you all up to date. After getting my toe-detection sort of working, I rushed to get some nice results for my milestone presentation at the end of January. One of those results was analyzing the roll off pattern of a paw. In humans, there are five distinctive moments which occur in nearly every normal foot roll off:

From: de Cock – de Clerq – Willems – Witvrouw – Temporal characteristics of foot roll-over during barefoot jogging reference data for young adults. Gait and Posture Vol 21/4 pp 432-439
- The heel strikes the ground
- The forefoot starts to make contact
- The forefoot reaches its maximal contact surface
- The heel comes of the ground
- The forefoot leaves the ground
These intervals are very reliable and have clear connection with the kinematics of walking, which makes them very useful for describing gait. So my first instinct was to start looking for something similar in dogs. But how?
I decided to first look at the pressure over time:
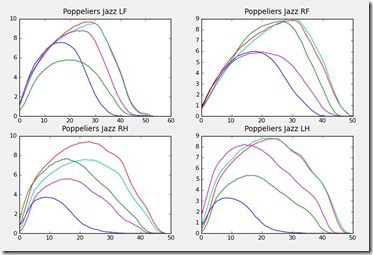
Clearly the start time of the toe regions is of no interest: dogs seem to place their paws entirely flat, so there goes every hope of a initial forefoot contact... Then there’s two other easy detectable characteristics: when is the pressure the highest and when is there no pressure under a toe?
I calculated it for every dog and threw them up a bunch and made a histogram: let the data tell me which event is the most reliable. Turned out the data was all over the place! Why? Because I forgot to normalize my results before comparing... Especially normalizing the time axis to go from 0-100% for each trial.
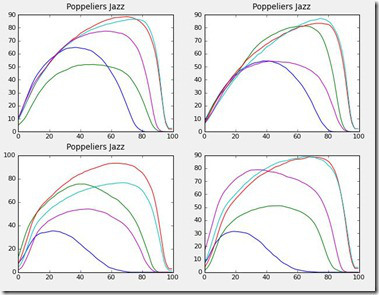
Now clearly that’s some of a difference, but what was more important, the graphs of all the dogs looked a lot more alike. So when I calculated the peak and end times again, I got the following table (pardon me for the Dutch, have fun with Google Translate if you can’t guess it):
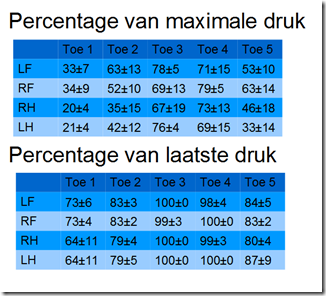
Note that I calculate the toe the same way for left and right, so while Toe 1 is always the central heel pad, the other toes are mirrored. If you then look at the table again, we spot a very high similarity between left and right. We can also see that the percentages are still all over the place...
I was almost tempted to just cut the roll off into four equal parts, because at least that would very repeatable and give us a clear overview of progression during the roll off. However, since that lacks any kinematical links, I decided to simply try several variations. But every combination resulted in some trials having only three frames in certain intervals. Then I looked more closely at the central heel pad:
- Start – Max = 0 to 20/30%
- Max – Heel off = 20/30% to 60/70%
- Heel off – Toe off = 60-70% to 100%
All the other intervals would be only a couple of frames of these moments and they have a very clear and understandable kinematical meaning!
After seeing all my results in one PowerPoint, you can imagine the clinic was very satisfied with the results so far! Even so satisfied that they gave me an external hard drive with another 100 dogs... Clearly somebody has not been reading how much work it is to process the data!