Well good question! Definitely not improving Joe's image recognition algorithm, though we did have some email conversations about possible ways to improve it. Probably the best way of improving it would be to have several training sets based on the actual walking pattern of the dog and it's characteristics.
Obviously, it's not fair to compare a small dog with a large dog.
So separating the data into smaller clusters that are more alike is definitely a way forward.
Another improvement is more a post-processing using heuristics, where each heuristic returns a probability of this paw really being a certain paw. As long as the probabilities are high enough, you can sort a larger portion with more precision.
What else is there to do? Well first off it would help to have some measurements correctly annotated that don't follow the pattern used in the algorithm. To make this task easier, I'm considering making some simple GUI that shows the entire plate with all the located paws and their order of contact and then let's you manually 'select'reach step that's incorrectly recognized and manually override the current annotation. And pray it doesn't look like this:.
Perhaps an easy version would highlight each paw in a measurement iteratively and ask for user input:
7 – Left Front       9 – Right Front

1 – Left Hind       3 – Right Hind
This would perhaps be a bit cumbersome, but perhaps I only have to perform it on 3-4 measurements per dog to help built up a better training set.
But perhaps the eventual results can be of help! You see, the heuristics are mostly based on some assumptions we have about what the data should look like. Well what better way is there to create new heuristics by letting the data do the talking?
So I started some number crunching using the measurements of one dog that we're surprisingly well sorted by the current implementation.
First up: a histogram with the step durations of each paw
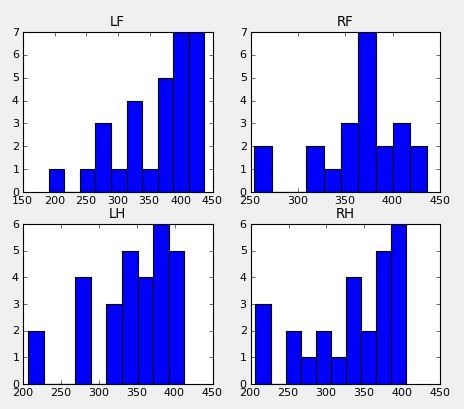
What's strange is the while the mean for each paw is around 350 ms, there are a couple of trials that are a lot shorter. So I decided to check if this was just random or if something else was the cause. Turns out: three trials make up all the trials with step durations below 300 ms! One was particularly notorious with 11 steps being faster than 300 ms. I can only hypothesize but my guess is that these trials came right after a trotting trial and the dog was still a bit overexcited.
When calculating the gait velocity (by subtracting the coordinates of the first and last paw and dividing these by the time difference) I came to an average of 1.10+/- 0.11 m/s (about 4 km/u). But when you look at the three trials with the short step durations: 1.38, 1.26 and 1.12. So yes, the dog was clearly walking above the 'average' gait velocity in these trials.
What else have we got?
Well I wanted to go for something basic: step & stride length! In humans this is calculated by the distance between the heel strikes of the left and right foot. But obviously a dog has four paws, so maintaining this definition is a bit strange. I then decided to calculate the distance between each paw and all the other paws, but I ended up getting lost in which paws I was actually comparing...
In the end I gave up for now, getting frustrated with not figuring it out completely (I blame the coffee!), but I did manage to calculate the distance between consecutive paws of the same side, so front right to front hind and vice versa. But I do plan on getting better results for this one!
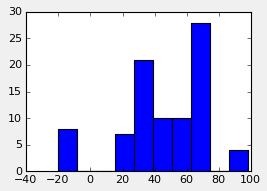
The –20 can be explained by a mix up in the sorting order. The 100 is most likely explained by a missed step. Everything in between needs some more research to be explained (what part = Front-Hind and what part is Hind-Front).
Why am I mixing things up?
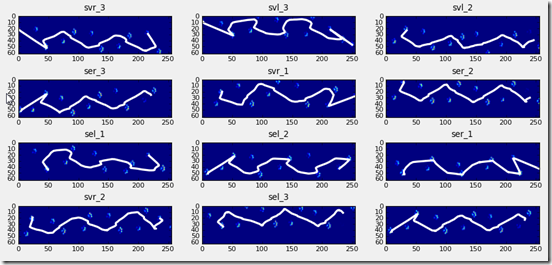
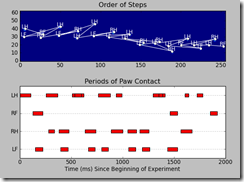
These are all the walking trials with the center of pressure (or mass) plotted over them. The center of pressure is calculated for each frame of the measurement and is a point where the weight of the body balances around.
The very sharp lines here indicate that a contact landed just on the edge of the plate often near the end of the measurement. However, these small contacts (which are often wrongly annotated too!) create an inconsistency in the pattern you normally expect and make in incredibly annoying to try and write algorithms from scratch. Next time, I'll first check for a certain pattern and only try to calculate steps there, as then I can at least guarantee a correct result.
Now for something more 'groundbreaking'! Most other pressure measurement systems used with dogs lack the resolution in sensor density to say anything about the distribution within a paw. However, as long as the dog isn't a chihuahua, this system does perfectly fine!
So I returned to my first SO-question: Peak detection in a 2D-array Which helped me locate the five toes in a paw. So far so good, implementing the calculation wasn't much of a problem. But visualizing it all the more! You see, I have about 60 impacts per paw, so when you make one graph out of it you get this: a whole bunch of spaghetti!
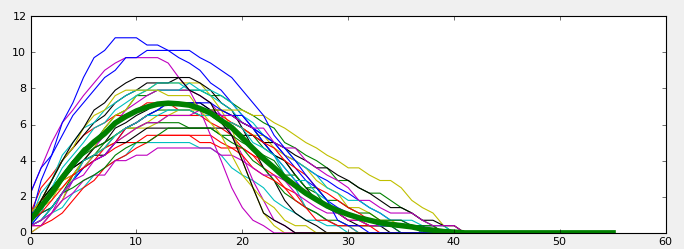
I decided to reduce this to an average (thick green line), to actually be able to compare them in a comprehensible way. But I ran into my next problem: not every trial has the same length. So if you want to do some nifty as using numpy's built-in toe1.mean(axis=1), you can forgot it, because an array needs all it's rows to have the same length... Ok so what do I do?
There's two options: either I rescale every item to a standard length (hard way) or I just create a zero filled array and stuff each item in there. The latter basically pads the data with zeros at the end to make them the same length. Now this too is a very basic task, but every time I tried to stick a row of data in the new array I would get an error: shape mismatch. Argh, I have to tell the new array where the row starts (at zero, duh!) and ends (len(row)?), problem solved!
Not so hard you think eh?
But then we started looking at the results (different paw this time) and someone complained about the wobbly shape.
I blamed this on the fact that the data is based on one sensor, namely that of the maximum pressure in a certain area. Peaks are often peaks for a reason, they aren't sustained for a long time. Also in 4 of the toes, there's a (sharp) nail which when pressed to the ground will exert a sharp peak of pressure.
So how do we make the data a little bit less sensitive to this peak alone? Well we increase the area!
def detect_peaks(image):
    # define an 8-connected neighborhood
    neighborhood = generate_binary_structure(2,2)

    #apply the local maximum filter; all pixel of maximal value
    #in their neighborhood are set to 1
    local_max = maximum_filter(image, footprint=neighborhood)==image
    #local_max is a mask that contains the peaks we are
    #looking for, but also the background.
    #In order to isolate the peaks we must remove the background from the mask.

    #we create the mask of the background
    background = (image==0)

    #a little technicality: we must erode the background in order to
    #successfully subtract it form local_max, otherwise a line will
    #appear along the background border (artifact of the local maximum filter)
    eroded_background = binary_erosion(background, structure=neighborhood, border_value=1)

    #we obtain the final mask, containing only peaks,
    #by removing the background from the local_max mask
    detected_peaks = local_max - eroded_background

    return detected_peaks
Here I was thinking the 'generate_binary_structure(2,2)' corresponded with my request of finding a 2×2 box around the peak pressure that shouldn't be in contact with each other. You know, like so:
But as I could see in my own results, I only had a 1×1 coordinate, that of the peak. Bummer! Ok, but if I have the coordinate of that point, can't I just go and add +1 in x and y and call it a day? So I try to add a slice to my new toe data. But I learn something new about Python slicing I hadn't thought off. Slicing counts from a point up to a certain value, not including the latter! This stuff just makes my day!
After getting this out of the way I got a new surprise, all the code I just had for padding zeros to fill up an array? Well that just got 4 times as worse, because instead of passing along 1D rows of data, now I was passing along lists with 2,2 shaped arrays. I couldn't make any sense of indexing these buggers! All I wanted was to calculate a mean! So I thought screw it: I'm going to sum up these for rows for each frame, so that I'm back to getting just a 1D row. Hoeray you think eh?
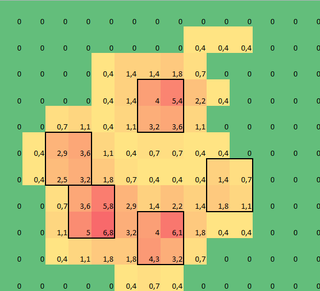
Turns out, for the small toe the mean was zero, yes zero! Because the pixels I was adding actually didn't have any pressure in them most of the time. Average that over a whole bunch of trials and you get: nothing! Back to the drawingbord...I decided to tweak the location of the index in a circle around the maximum and see what results this would give me. Here's a snapshot where blue is the maximum:
Clearly not using the other sensors would be overestimating the pressure in that area and not only that: the shapes aren't the same either. So I tweaked the position, so that hopefully this effect has been reduced somewhat! The result of all this blood, sweat and tears:
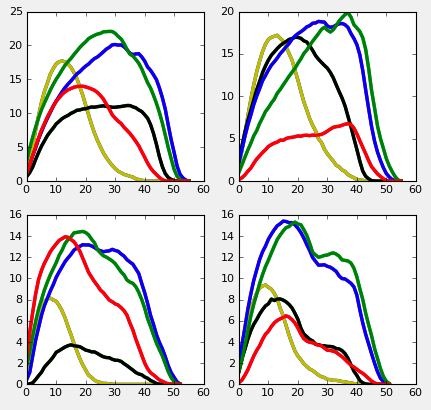
Interestingly, there's a clear difference in the peak pressures between the front (top) and the hind (bottom) paws. Furthermore, I should note that I didn't mirror the ordering of the toes from left to right. Currently it picks the rear toe as toe 1, because it (almost) always occurs as the first, spatially speaking. Then I sort the remaining coordinates in ascending order, toe 2-5 are then assigned in the order they occur. While this seems to work, it's clearly not perfect, because it doesn't take into account that if a paw rotates far enough, these sideway positions may change. In the future I should probably take into account the distance from each toe to toe 1 and see in what direction it points.
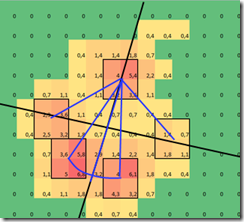
Something else I could consider in the future (using the lines in the picture above), is rotating each impact to put it in a neutral position, from here the toes should always be in the more or less the same area.
This angle of rotation is interesting for multiple reasons. It let's me rotate paws back to a neutral position, which helps with the image recognition, because it reduces the variance between the paws. In humans certain problems are associated with excessive rotation of the foot (either internal or external).
And if you want to describe the amount pronation or supination (rotation of the foot in 3D), like in the image below, you need an axis to describe this rotation.
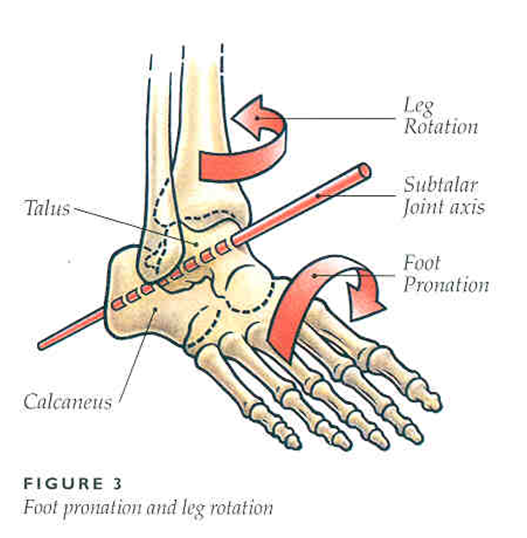
In humans it turns out there's a strong relation between the amount of pressure on the medial side (towards the body's core) and internal rotation of the shank. So why wouldn't it be the same with dogs? Therefore, if we can divide the paw into two halves, we can compare the pressure under both halves and hopefully say something smart about the movement of the leg above it. Considering the clinic wants to evaluate the gait pattern of lame dogs, I assume this will be very interesting!
Something else, I'd love to figure out is a classification of the roll off pattern. In humans we have the following:
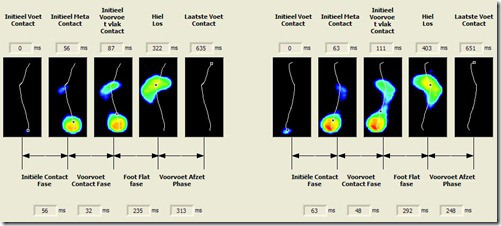
Which describes five moments in the roll off: heel strike, initial forefoot contact, forefoot flat, heel off and toe off. These five moment literally occur in just about every healthy humans roll off, so now I'm left wondering what the equivalent is for dogs.
From the graph with the pressure under the toes at least one phase can be deduced and that's 'heel' orf as far as you can call the fifth toe in dogs a heel. I'm sure there must be other moments we can deduce from this. If anybody has any suggestions, leave a comment!
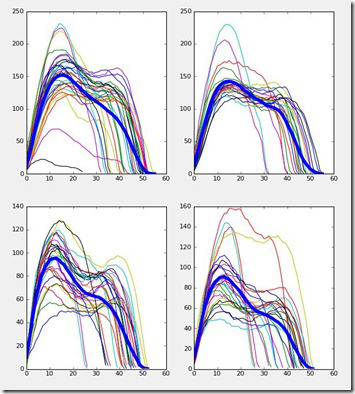
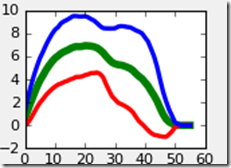
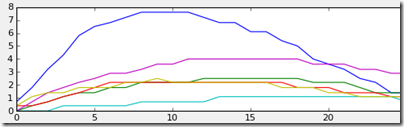
Here's the total pressure under each of the four paws, where the thick blue line is again the average. Perhaps that first bump can be interpreted as initial forefoot contact or even already foot flat. The second bump is probably preceded by the heel lift, which is probably a more reliable measure.
Anyway, I think I've made some progression getting these results out of these measurements. There are a few kinks I need to solve, but after that I will try to apply it to other measurements. Perhaps one idea would be to calculate everything for each impact and cluster them according all the results and then see how many 'false' positives we get!
For everyone who made it this far, feel free to leave a comment if you have any questions or want more information!