After my initial problems with my toe detection, based on the problems I was seeing I wanted to try two things:
- Increasing the binary structure that's being used for looking for peaks;
- Resizing the paws to better match the 'ideal' size
So I made a loop that would try different binary structures (array with True values) to see what the result was. But the results didn't really seem to improve, whether I used a 2×2, 3×4, 3×5 or even a 5×5 structure.
To see why this wasn't doing what I expected, I dug a bit deeper into the toe detection function.
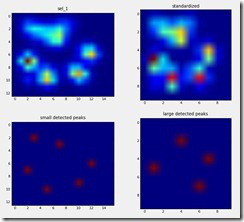
local_max = maximum_filter(image, footprint=neighborhood)== image
Here image is the top left figure, neighborhood is the binary structure and maximum_filter thus returns the maximal values within areas of the size footprint in image. I was under the impression that the size of neighborhood was a unique area and wouldn't overlap with other areas. Here's a plot of
maximum_filter(image, footprint=neighborhood)
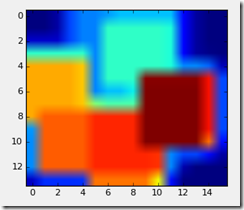
Turns out, as long as the maximum values don't overlap, the areas can overlap as much as they want! So clearly, once again, I didn't really know what to do with this to get the wanted behavior from it.
Therefore I got out plan B: resizing. I started out with a combination of both methods:
- the default sized paw with the standard toe detection,
- the resized paw with the standard toe detection and
- the resized paw with an altered version of the toe detection.
I started out with a small dog and looked to see if it helped interpolating the image, so I had more pixels. You see, looking for 5 maxima within a 3×3 area in a 8×8 sized array isn't going to work out. So I tried several sizes, scaling them to 10, 12, 14 and even 20 pixels to see whether it would pick more toes.
But after several iterations and tweaking the binary structures in combination with reshaping, it was clear that most of the small dogs measurements were beyond salvation. The only paws that would ever get 5 peaks were probably all front paws, meaning I would never be able to compare the values among the four paws. So I hereby declare all the small dog trials trash! Note that I can still divide them into quarters and compare those, but that's beyond the scope of this project
Next up were the large dogs. While I don't have any figures to prove it, it turns out that it would vary per paw whether resizing helped or not! So sometimes having a different binary structure or size would get me 5 toes, but it would get me 6 toes on another and vice versa. Note to self: did you check whether this was for front or hind paws? Perhaps there's a pattern
More frustratingly is that the resizing settings that worked for a large dog didn't work so well for my 'ideal' sized paws! I decided that just messing around wasn't getting me any further, so I first did a basic filtering:
Calculate an average for all the paws of the same dog and resize them to the same size for all dogs. Then use the standard toe detection to see what it gives. If the results yield anything less than 4 or more than 6, they're out.
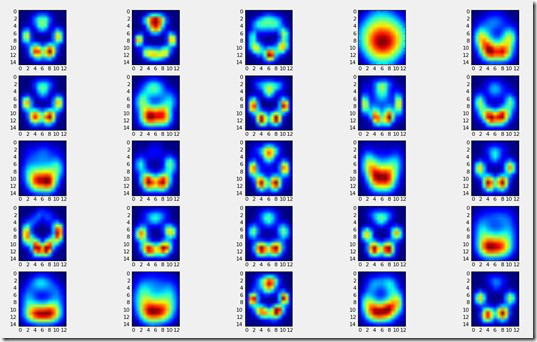
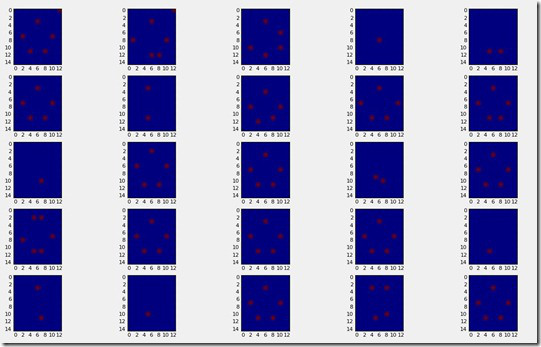
As you can see, it actually performs very well on most 'average' resized paws. And interestingly enough it directly tells me which all the small dogs are as their data is in nearly all cases just a gigantic blob.
Seeing that in all the other cases it seems that it's perfectly capable of finding the toes, it seems this should work, even though trial based inspection gives a different impression. Assuming that on average the toes are more or less in the same place, I could create a 'mask' where I manually tell which areas belong to which toe. Once I have several of these masks, I could run them against a measurement to see which combination of toe locations gives the largest sum overall.
Anyway, at least I'll know what I have to do tomorrow!
But before I go, I just wanted to share you something I'm particularly proud of, because I wrote it without any help!
I call it: the manual paw annotator v0.1!
Basically what it does is, it plots a measurement, shows the annotations from Joe's sorting algorithm and displays the chronological ordering (the white line), then it starts to loop through the list of paws and highlights them one by one and prompts the user for input.
 Current annotation for this impact is : RH
 What would you like to change it into?
 7 = Front Left —————- 9 = Front Right
 ——- 5 = Keep current annotation ———–
 1 = Hind Left —————— 3 = Hind Right
 Enter your choice: 3
 You chose LH
I mapped the paws to the keyboards numpad, so that it feels slightly natural to annotate the paw with a similarly spatially located key! All I need to figure out now is:
- how to overwrite the original object in Joe's data.hdf5 file and
- how to let a measurement know I manually checked it, so don't dare to ask me again unless I say so!
With this function, I can easily sort through several trials for each dog and built up a more curated training set for the automated sorting. Especially for trials where the dogs didn't follow the trapezoidal pattern, as the algorithm seemed to perform particularly poor here.
That's it for today and once again if you want to know anything or have suggestions: leave a comment!