When I started on the data processing my first goal was to see if I could find my way around Python’s syntax and started on seeing how far I would come on some basic processing. Normally when I think of a pressure measurement, I’m looking for things such as:
- the maximal pressure over time
- the center of pressure for the entire plate and within each contact
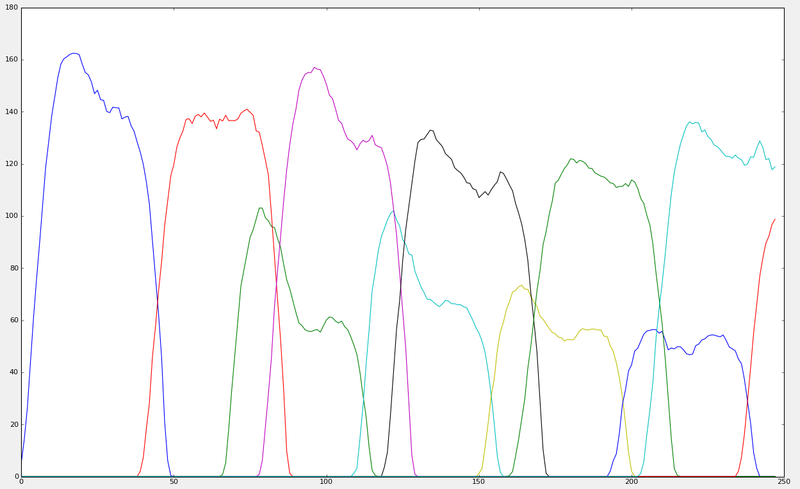
- the total pressure under a contact over time
- recognizing the different contacts (front vs hind, left vs right)
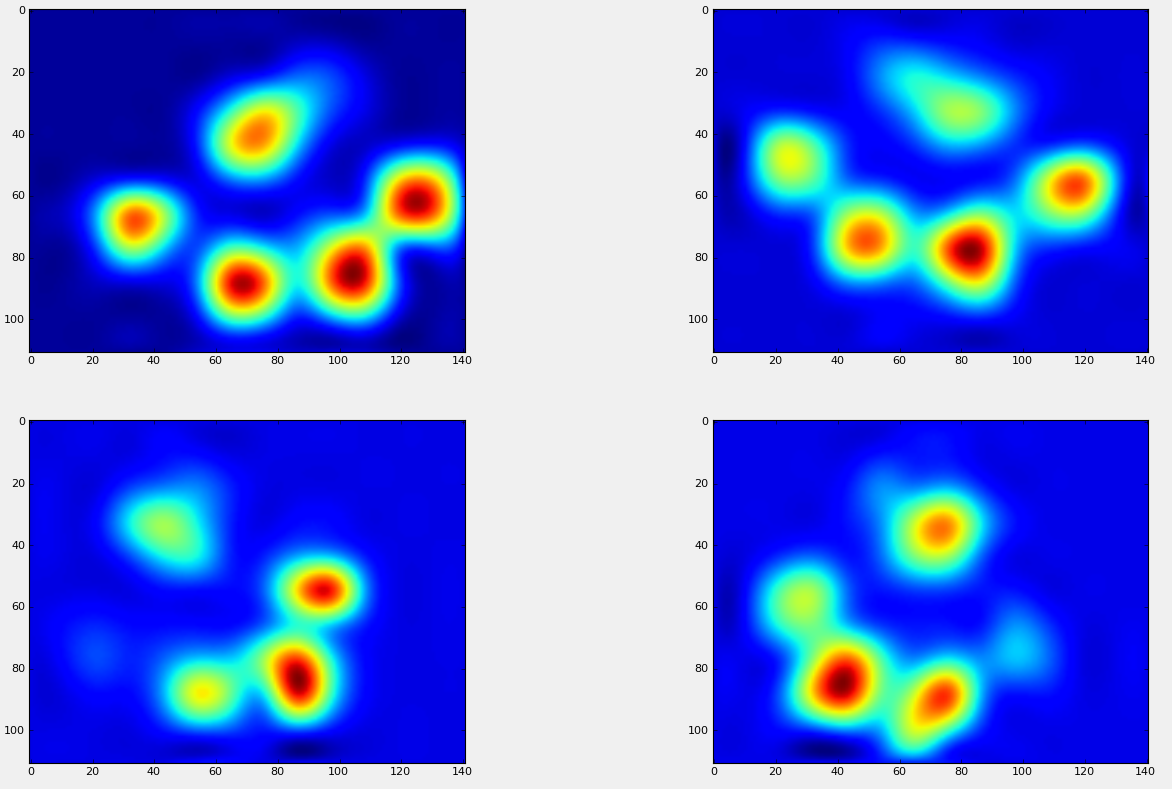
- recognizing anatomical structures (toes and fat pad)
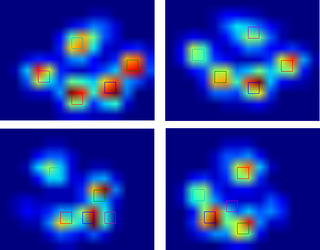
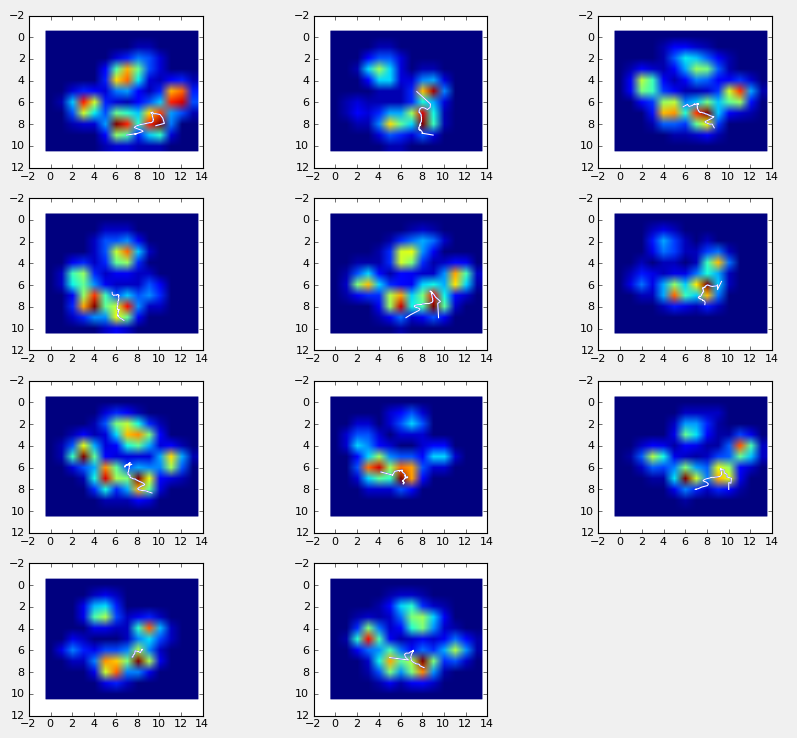
As you can see I managed to get quite far with just one experimental measurement (thanks SO-users for the help on that last one). However, before I tread any further, I first want to see how the code holds up to other measurements. If there’s one thing I’ve learned from measuring humans, it’s that Mother Nature likes variation and not two measurements tend to look alike (OK, I’m exaggerating, but you get the point).
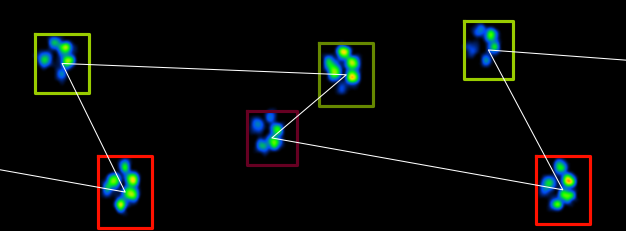
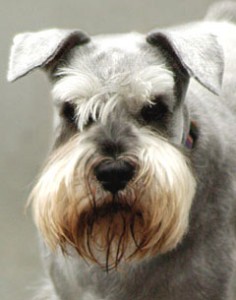
One hiccup I’m already anticipating is paws that overlap in position. When looking up the paws in my entire plate file, I did something naughty and just looked at the maximal values for each sensor and extrapolated all the areas that were non-zero. This works perfectly fine in humans, but in contrast to humans, dogs have hind legs which tend to get in the way of things. So I’ll have to alter my code, so that after I found all the non-zero areas, it checks if the sum of the pressure within that area goes to zero somewhere somewhere during the measurement and split it up at that point.
Another hiccup I expect is with the paw recognition (front/hind,left/right). While my example above was nice enough to put his paws nicely wide spread, there are also dogs that have a more ‘sexy’ walk. Which means that left and right aren’t as easily separated as above, where I just took the origin of each paw, calculated a mean and made anything under the mean right, above the mean left.

The biggest problem I’ll be facing after that is dealing with small dogs or trying to get the most out of their measurements. As I explained in an earlier post little dogs, exert little force to the plate which uhmmm... is a bad thing. So it will be interesting to see how this will progress.
As for what I’m doing right now: all data has been exported and uploaded to both Dropbox and SkyDrive. As I had reported here earlier the files are pretty huge, but to put my Super User-ness to shame: I didn’t compress the data!
This was actually quite dramatic since it reduced about 400 Mb to only 1 Mb… How come? Well while each frame has over 16.000 values, 99% of those are 0.0, which is excellent when you start compressing it. So if anyone wants to play with the data: here’s the SkyDrive link, for DropBox shoot me an email and I’ll invite you
My next step now is taking a random samples to see how well my code fares with different measurements, if it holds up I’ll start splitting up my over-sized script into separate modules, so I hopefully don’t break my script all the time.
If anyone is interested in anything specific, leave a comment or email me at ivo dot superuser at gmail dot com!